An in-depth look at how credit unions fared in 2020.
1. Introduction: As balance sheets have changed, so have the challenges facing community financial institutions.
2020 did not make things easy for community financial institution leaders. First COVID-19 closures, then an influx of deposits, deciding whether and how to reopen, operational challenges, not to mention static low rates. Now you're probably ready to have a better picture of how the current economy and changes in consumer behavior will influence your ability to do business. That’s why we analyzed the national data on your behalf and highlighted some noteworthy trends. We also compared how our own clients stacked up against their peers across the nation.
You can dive below the surface and see how your peers are doing.
We examined the data and sliced it into digestible layers, helping you make sense of changes in rates and consumer financial behavior in 2020. Why would we invest resources in a project like this and offer it for free? Because Kasasa is passionate about partnering with locally owned financial institutions, who in turn help consumers and their communities. Our clients depend on us for accurate, actionable insights to help them perform so highly (although, we can’t take all the credit for their exceptional success).
Monitoring industry trends can help you make better strategic decisions.
-
These data will help you understand how the economy and consumer behavior in 2020 affected your financial institution (FI) compared to other similar FIs.
-
Gaining insight from 2020 can help you plan ahead.
-
Most FIs are making important decisions without good macro-to-micro data about the industry and their business.
-
-
The comparisons address the primary financial drivers for your FI, or key factors that affect those primary drivers:
-
Total deposit growth
-
-
-
Total loan growth
-
-
-
Total net revenue growth
-
-
-
Net interest margin
-
Return on average assets
-
Non-interest income as a % of total revenue
-
2. Looking at the nation’s financial institutions as a whole.
Credit unions are flooded with deposits.
-
Deposits grew 10x as fast as the median growth of the three years prior. And the overall median growth for loans saw a 3.4% decline. The average growth across credit unions was positive and this growth was skewed by the larger institutions.
-
This was due to consumers pulling their money out of the stock market, the stimulus package, and an overall reduction in consumer spending
-

-
-
The median year-over-year growth was consistent across the country with credit unions above $10MM in assets and in the Midwest (23.2% growth) and Northeast (22.4% growth) regions seeing the most growth.
-

How does your growth compare? Request your Benchmark Report.
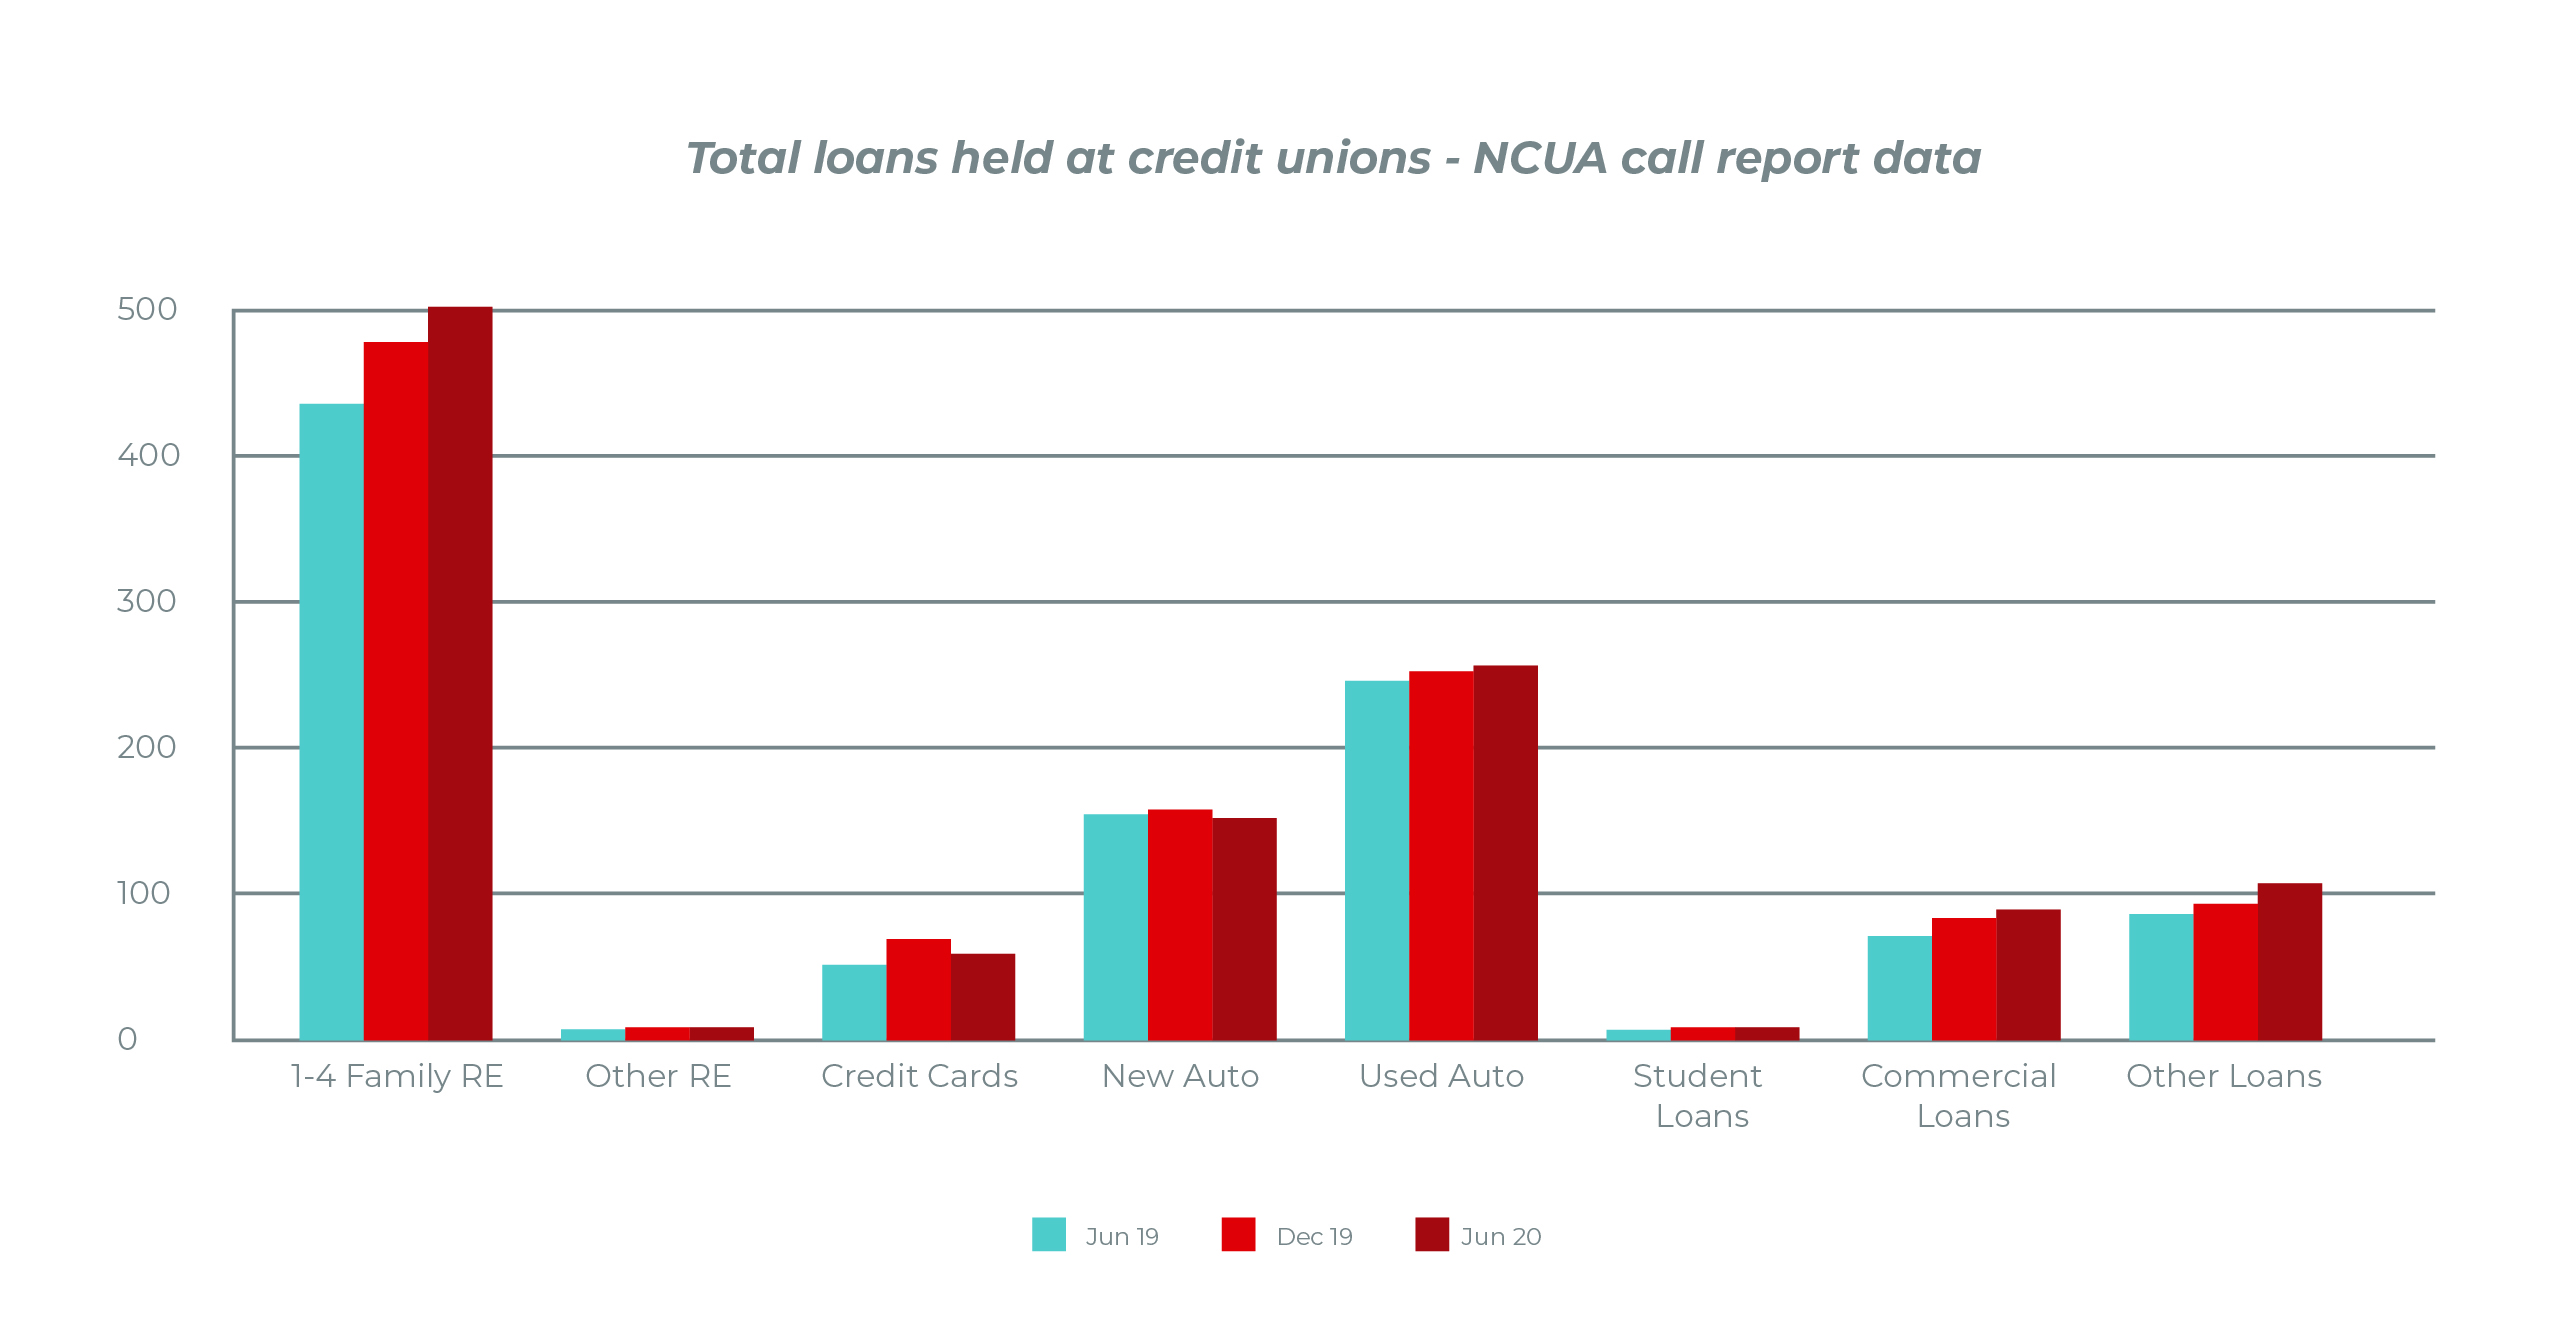
The overall median loan growth dropped for credit unions.
Large credit unions are the only ones to see small positive growth.
-
Smaller credit unions and those in the Northeast (-5.7% growth) and South (-4.2% growth) saw the biggest declines in loan growth in 2020 compared to 2019.

-
Credit unions didn’t benefit from the same PPP lending bump as banks. Most growth came from mortgages, used auto and commercial loans, and were in line with historic annual growth.
-
The spike in consumer mortgage comes as no surprise: people are taking advantage of the lowest 30-year fixed mortgage rates since 1971. Savvy consumers want to lower mortgage costs or adjust the term to keep money in their pockets or make home improvements.
-
Competition for loans is getting even more heated as nonbanks continue to increase their loan origination share.

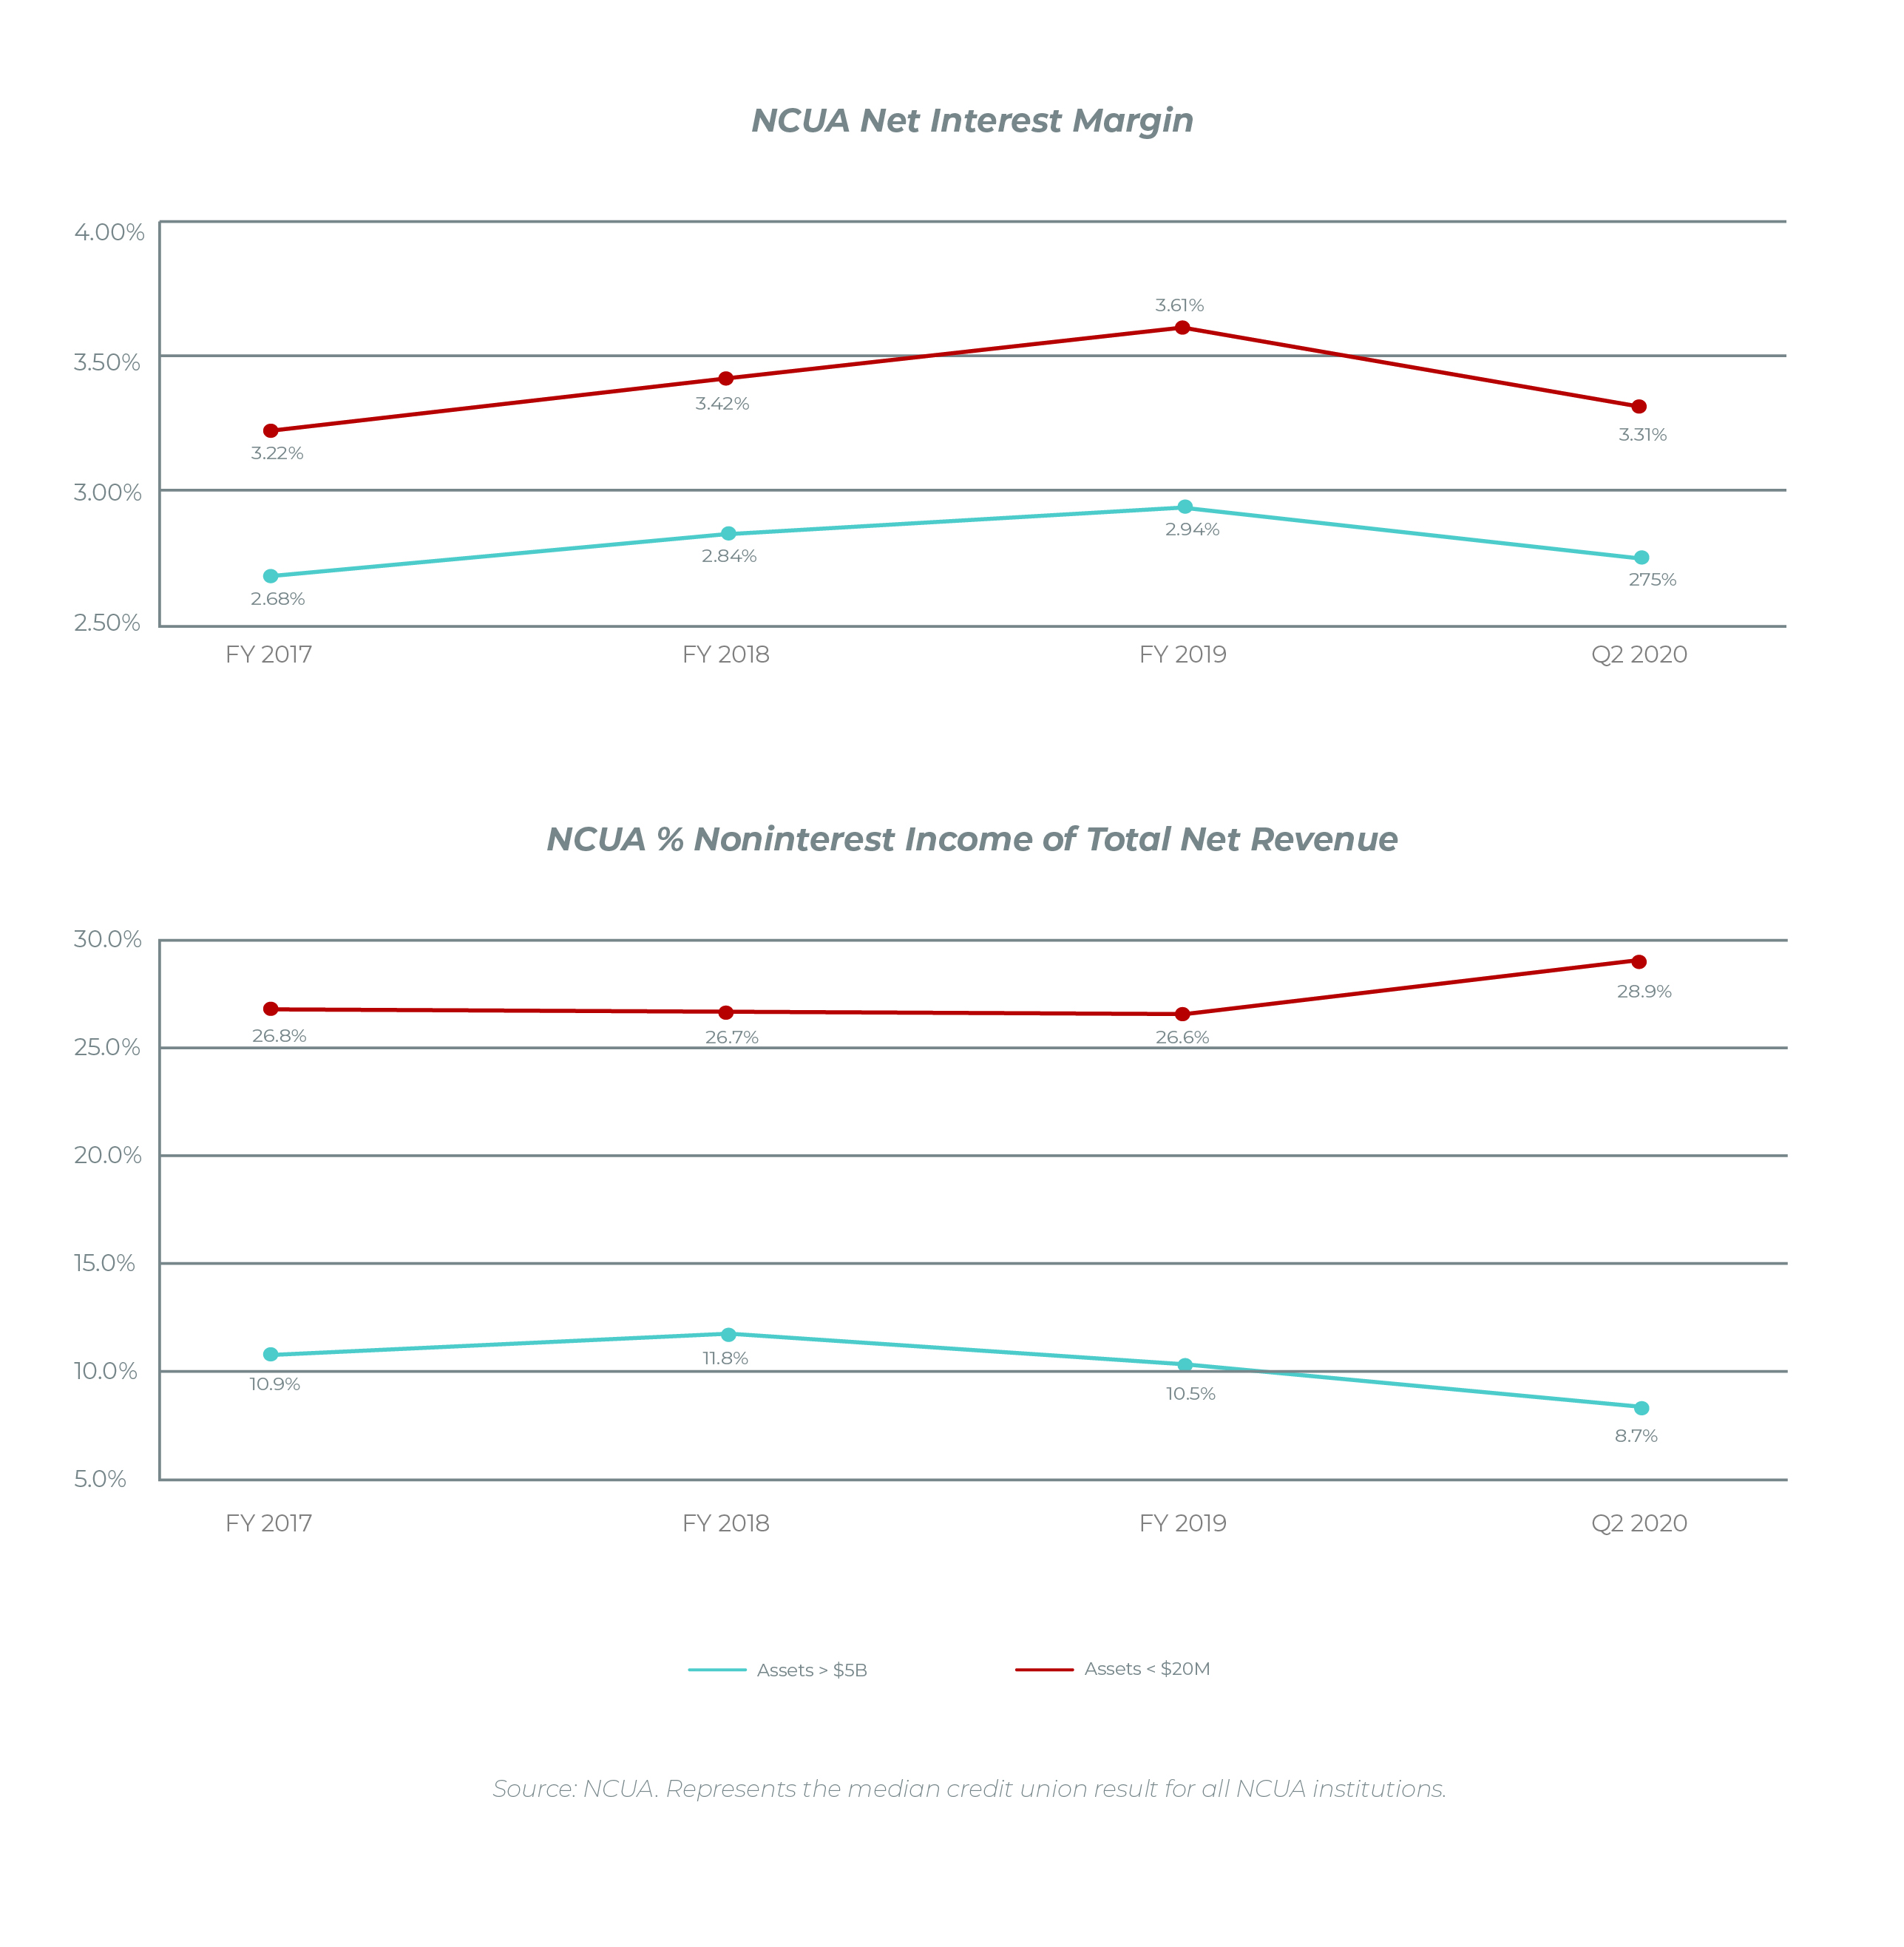
Overall profits are tightening for credit unions as interest rate margins compress due to the low-rate environment.
-
This is not a surprise given that 69% of financial executives told American Banker in August shrinking profit margins were one of their top challenges during the pandemic.
-
Return on assets was 0.38% in Q2 2020, down from 0.60% in 2019.

-
Credit unions started to experience net interest margin (NIM) compression in Q1 2020, falling to their lowest levels since 2017. NIMs are expected to continue a downward trajectory in Q3 as the pandemic fully hits credit union balance sheets (3.22% in Q2).
-
This is especially meaningful to smaller credit unions with higher exposure to margin compression who don’t have comparable non-interest income streams to bail them out when rates fall and NIM compresses.
Credit unions rely heavily on interest income.
-
78% of credit unions’ Q2 2020 income came from interest income; and only 22% from non-interest income (NII). Smaller credit unions have healthier NIMs than big banks, but they can still be vulnerable to rate cuts.
-
Credit unions aren’t relying as heavily on fee-based income, which is back down to the level we saw in the mid-90s, after peaking right before the subprime crisis.
Takeaways for credit unions
-
While businesses were still borrowing, personal and home lending didn't kept up. But consumers are looking for financial partners to help them get competitive loan rates and manage existing debt. If you need loans, you should be targeting these types of consumers with your marketing.
-
The competition for these loans was very strong in 2020. You may not see neo-bank branches down the street or nonbank lenders sponsoring the local high school team, but you can be certain that they’re targeting borrowers in your community.
-
There’s only so much you can do to control net interest margin based on where the Fed sets their target rate. Building a stable stream of non-interest income is good way to hedge against interest margin compression, as long as it’s done in a consumer-friendly way.
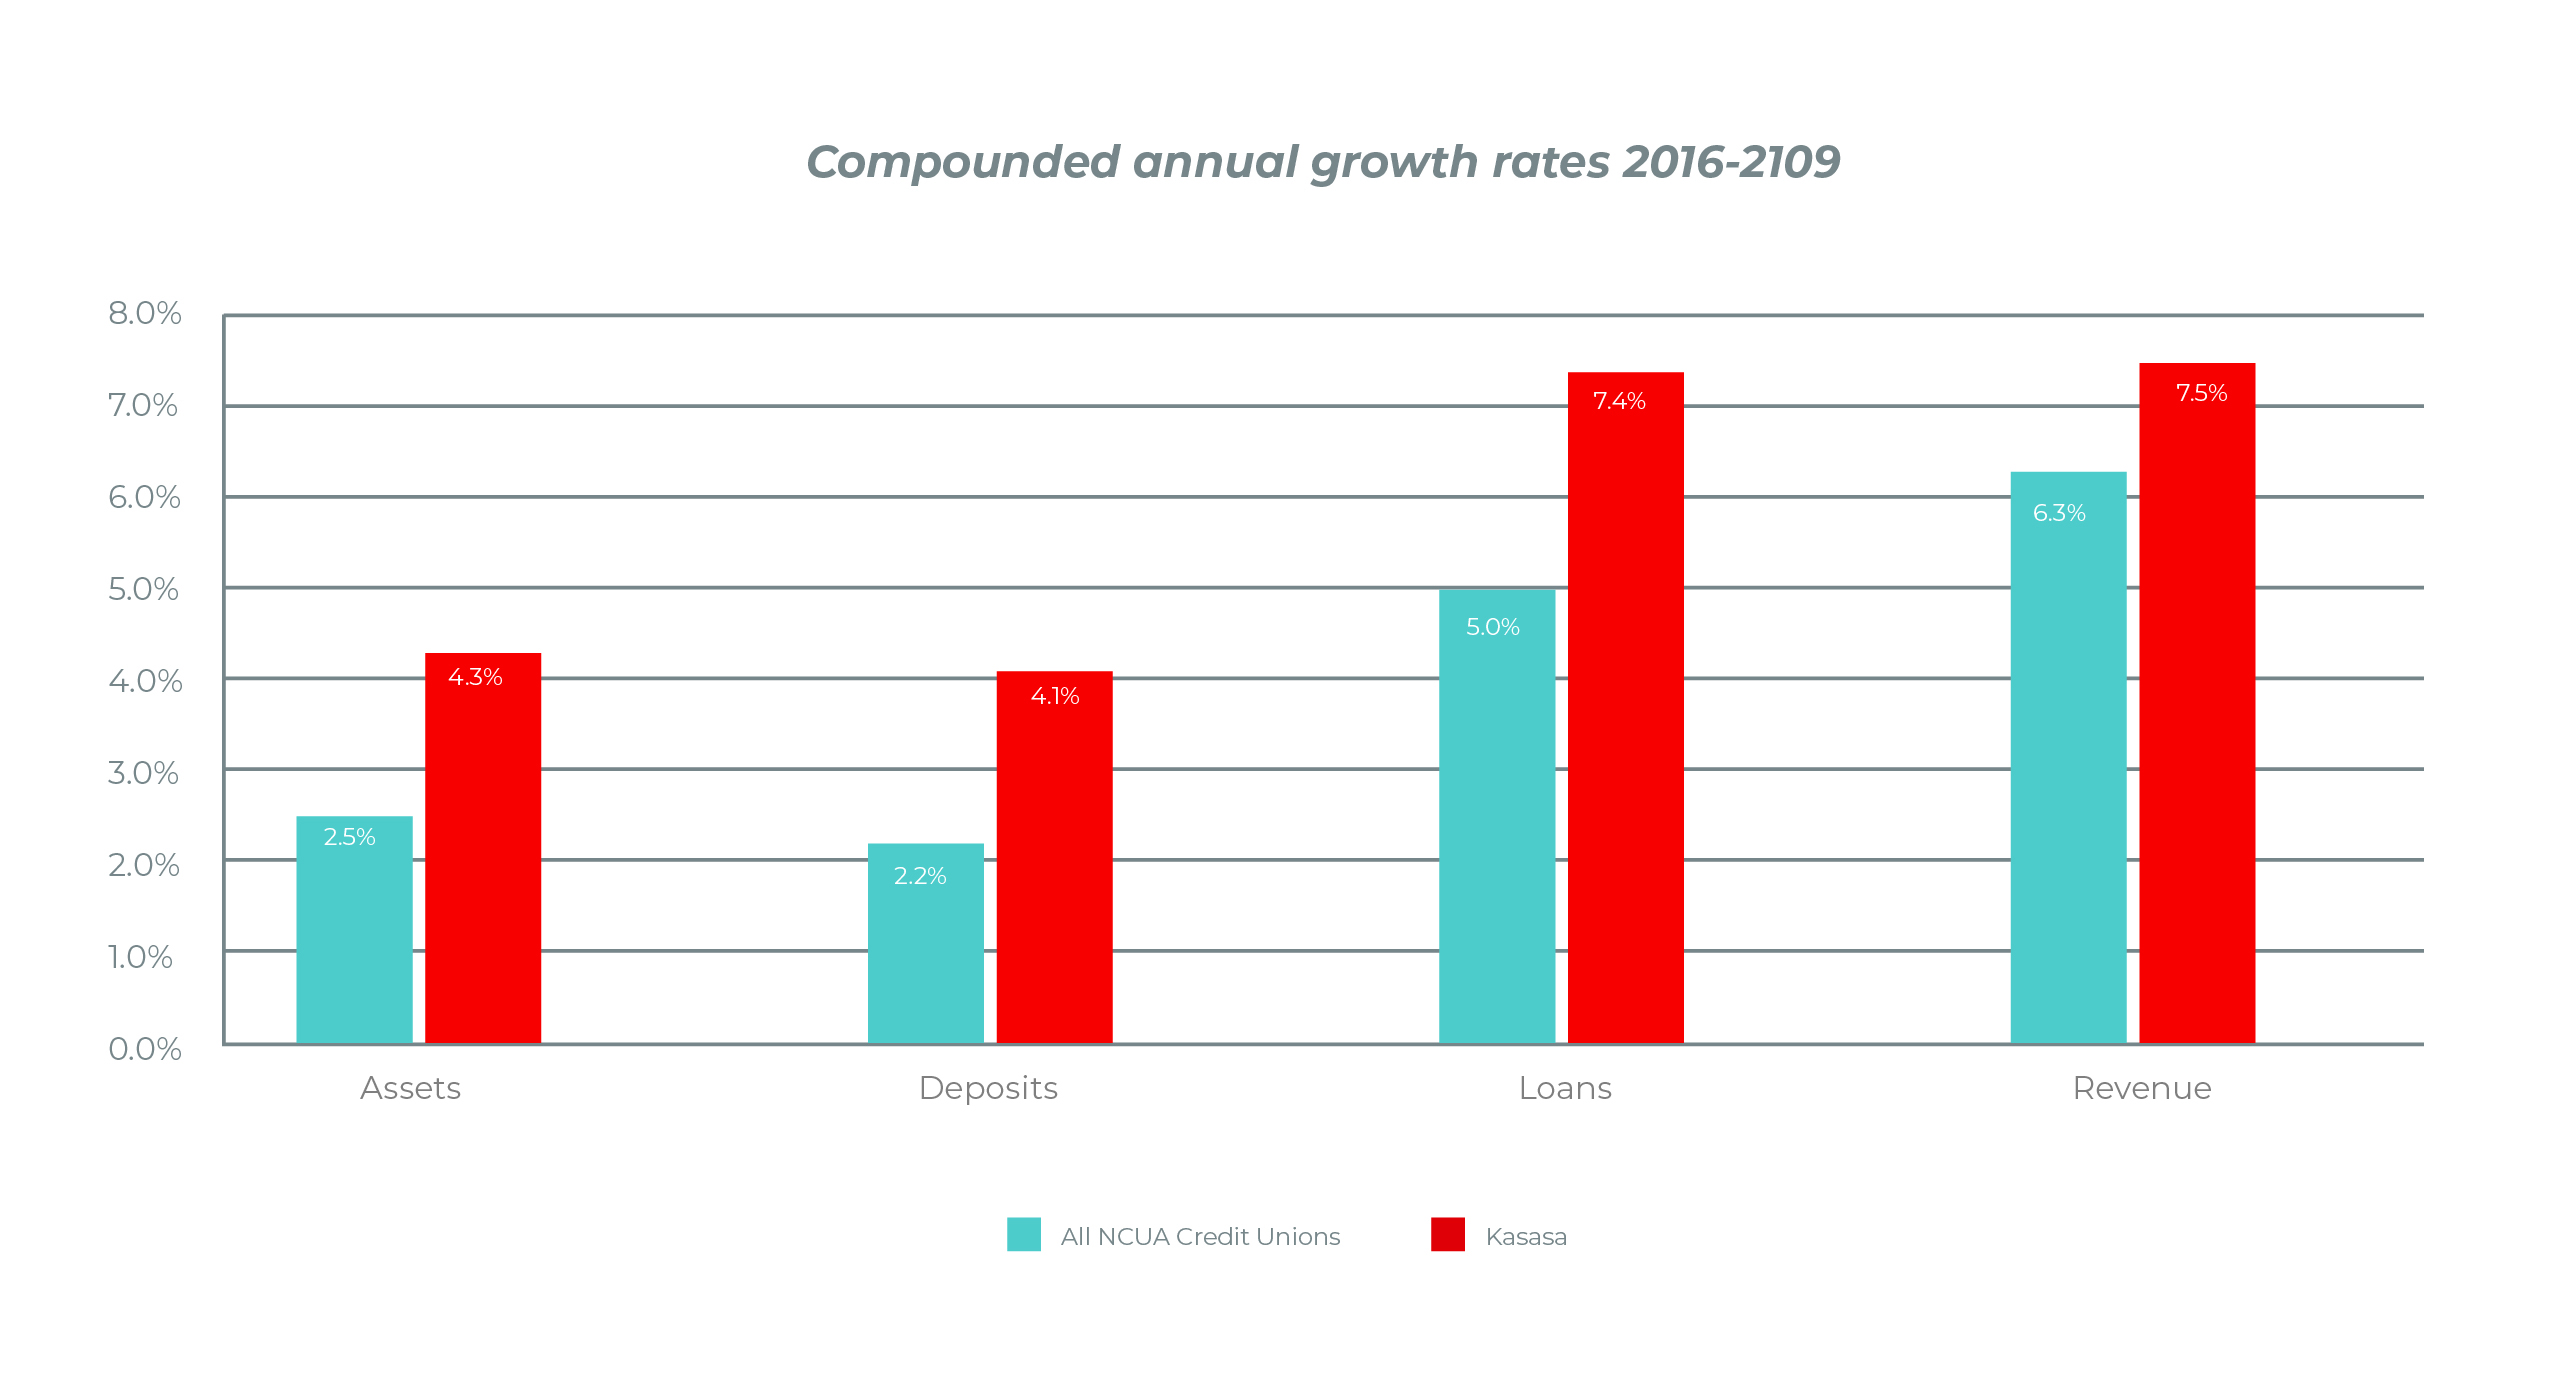
3. Kasasa clients form an exceptional cohort of trend-bucking FIs.
Kasasa clients are signaling strength, consistently outperforming other credit unions. This is likely due to a range of factors that includes partnering with Kasasa and extends far beyond our partnership. These financial institutions are executing on high-performing strategic plans that transcend asset size, location, or consumer demographics.
-
Kasasa supports FIs who seek to recapture market share from megabanks, neo-banks, and local competition. We provide innovative banking solutions that:
-
Increase younger, more profitable members 50% in the first year.1
-
Increase non-interest income (NII) by 45% for reward checking on average when compared to standard free checking.1
-
Help cross-sell additional value-added offers that generate stable NII.
-
Help drive more originated loan balances with a loan product that 98% of consumers want to refinance their debt with if given the opportunity.2
-
The clients who choose Kasasa are part of an elite network of outperforming credit unions.
-
They’re among the most financially fit credit unions in the nation.
-
They have access to proven solutions to grow their member base and increase profitability.
How does your growth compare? Request your Benchmark Report.
1 When compared to standard free checking accounts per Kasasa Analytics 2018.
2 Based on 2017 Kasasa Consumer Study.
